
It’s funny the things that pick up on Twitter. I can’t even remember what it was that spurred the above tweet, but it certainly has sparked interest. What was in my head?
Well, first of all, that I really worry about when metaphors are used that I think confuse rather than help. A roadmap is a very precise thing in my mind – a relatively accurate, to scale, graphical representation of roads and paths in a particular geographic location. It conveys information about physical spaces and the geographic relationships between things in those spaces. It is static, although probably used to help people who are moving. A roadmap has absolutely no representation of the concept of time, although times can be inferred by measuring distances and then doing calculations based on expected speed of travel. SatNavs of course do that in real-time.
This is what a roadmap looks like:
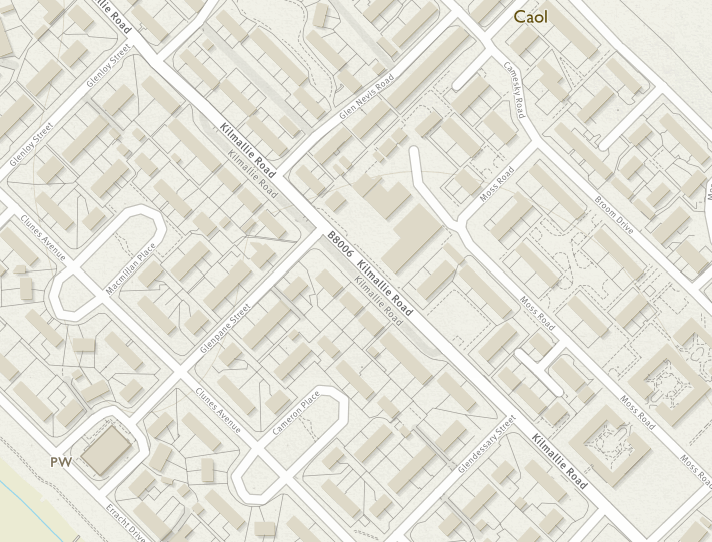
(From https://osmaps.ordnancesurvey.co.uk/56.83766,-5.09868,17)
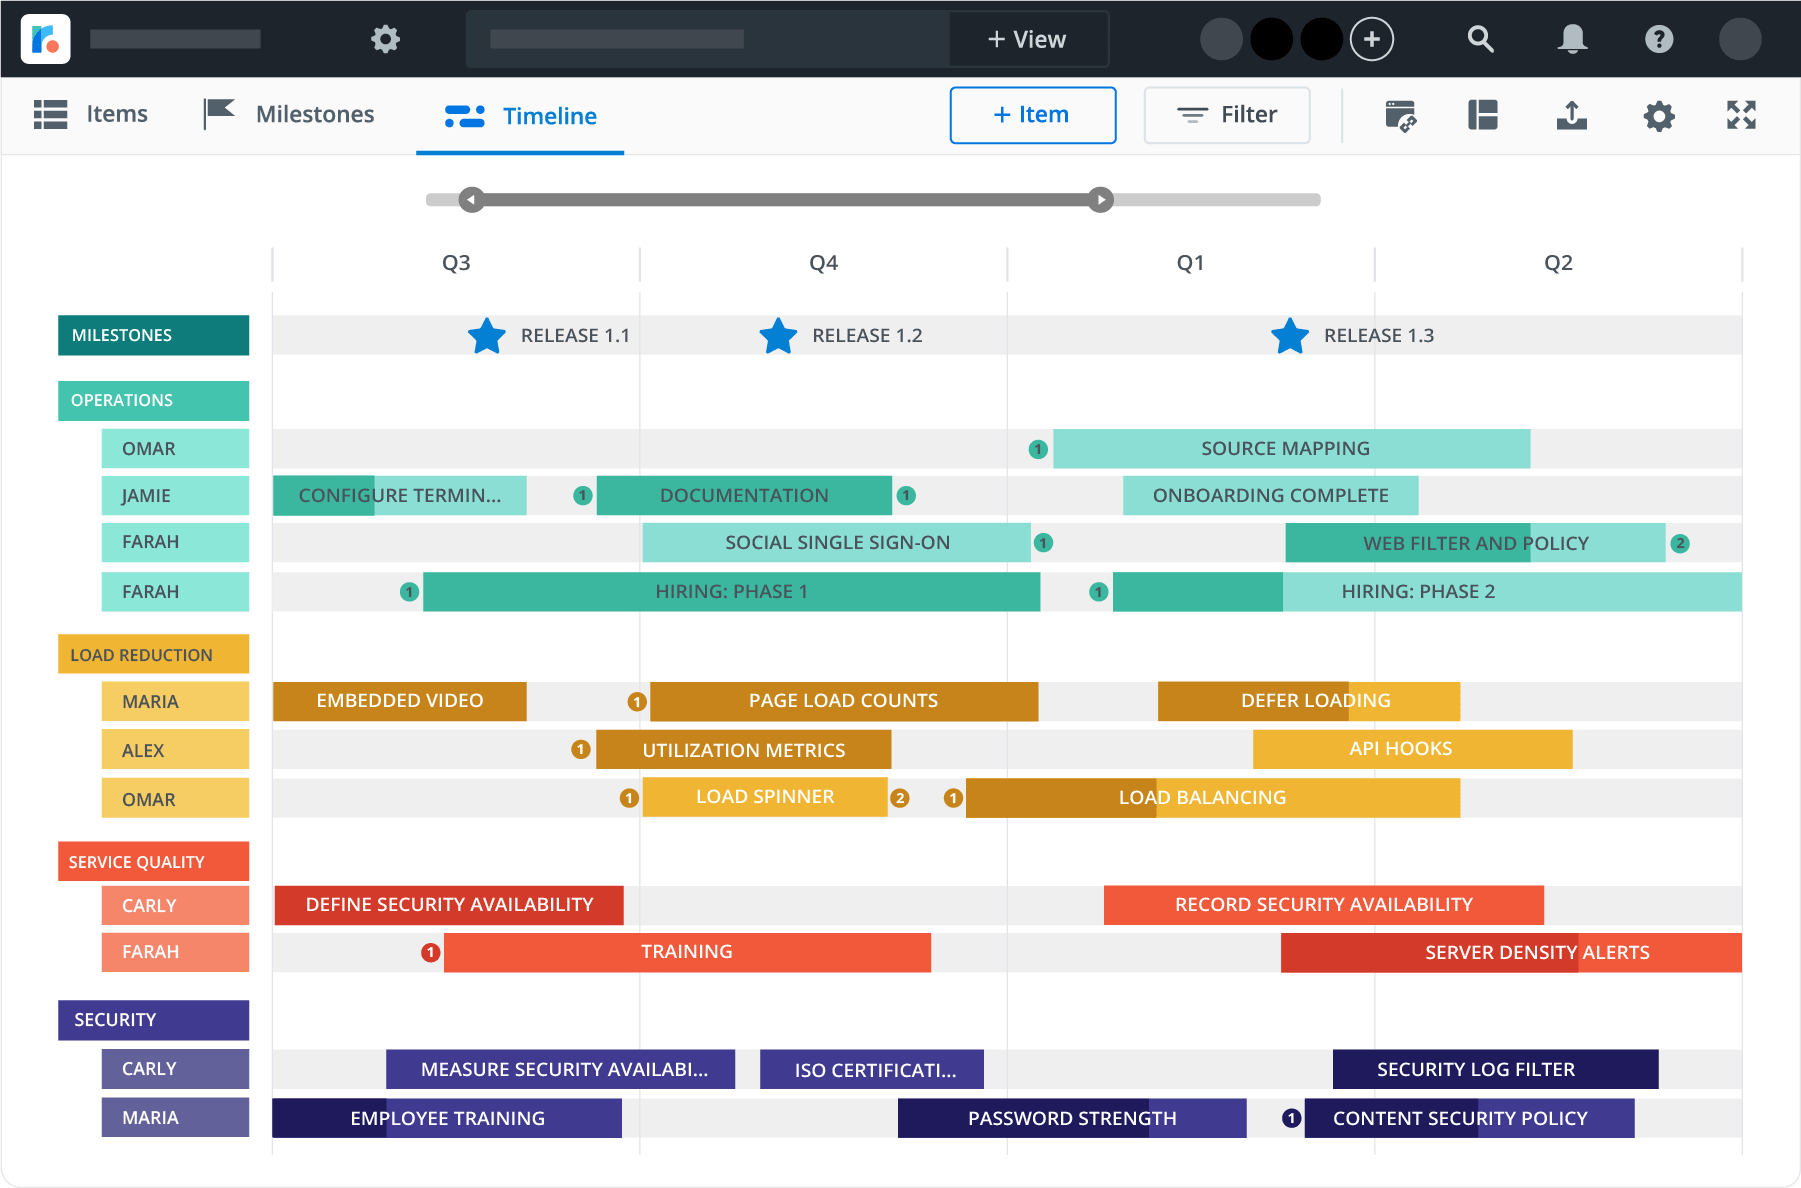
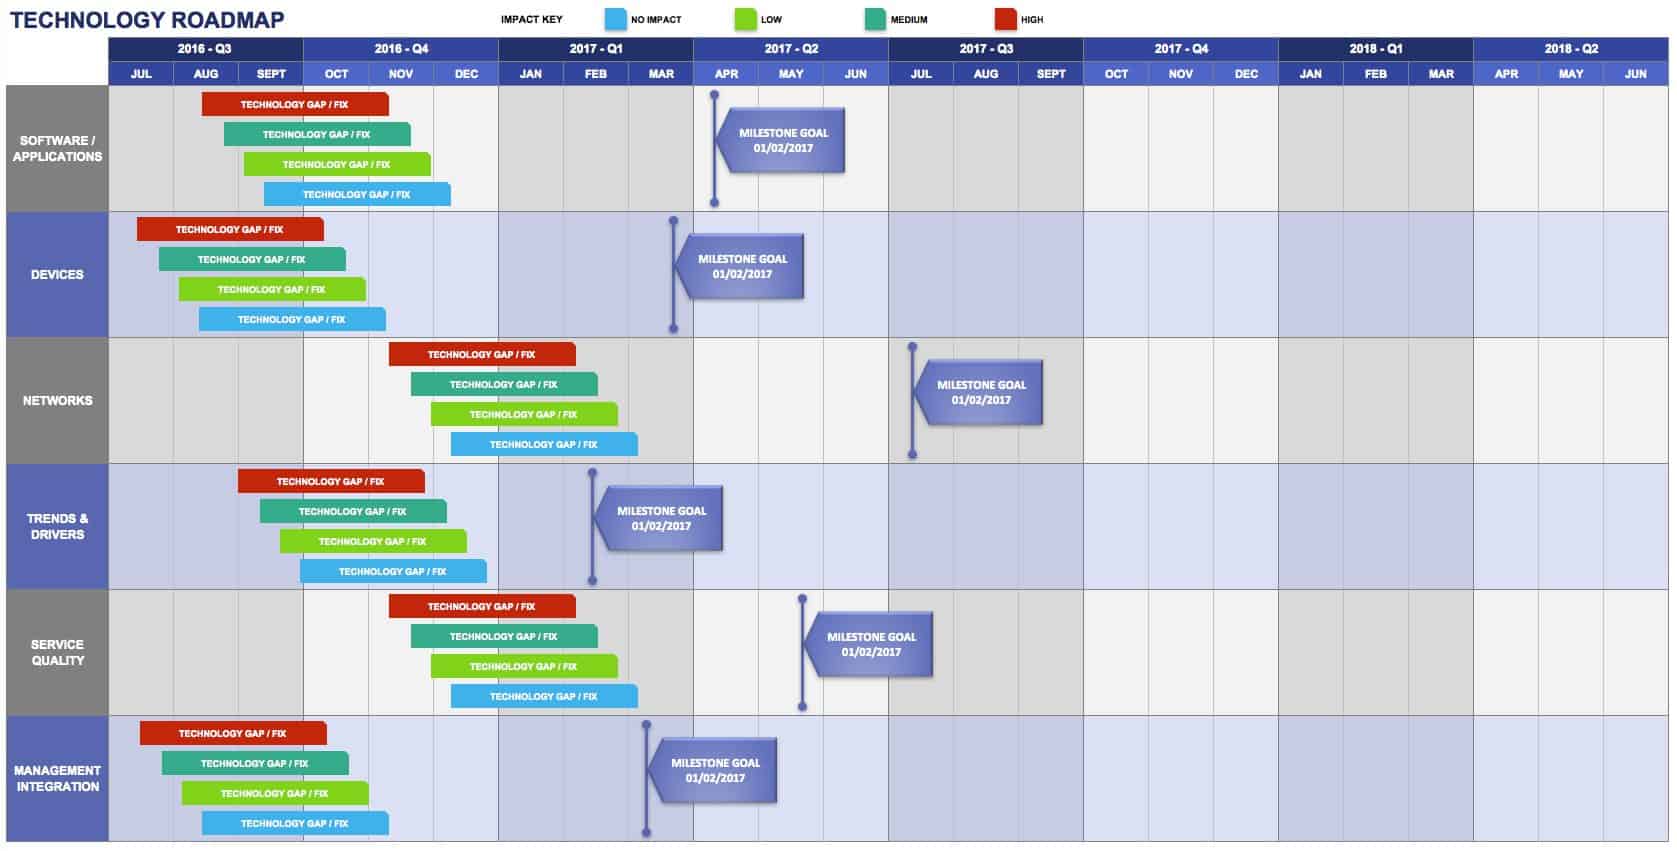
Now let’s do a Google Image search for what a Technology Roadmap looks like:
Hmm.
Oh.

Ah.
See the difference?
These aren’t anything like a map. They’re Gantt Charts.
But they are also increasing vague and unhelpful Gantt Charts because, as we move into increasing reliance on Agile Methods in the world of technology what we have discovered is that, for the most part, making commitments to when something will be delivered at any point in the more distance (eg +3 months) future is a fools errand. The future is unpredictable.
But humans, and their creations “Organisations” and “Businesses” crave predictability, certainty and magic crystal balls. It’s no coincidence that so many software products have been named things like “Sage”, “Oracle” and “Delphi”. We want to know what the future holds, and will have a strong belief in someone or something that convinces us that they can tell.
They probably can’t. Sorry about that.
When it comes to understanding what the future might bring, we have to take ownership of the decision-making processes that will shape it, rather than looking for prophets who can divine it.
So an actual technology roadmap might be useful, but maybe not. Let’s be honest, where things physically sit is rarely important. We are looking maybe instead for a technology schema. Something, perhaps, like a tube map.

In the tube map, the dependencies between stations are represented, but the distance is irrelevant. You can then overlay elements of time, like in this version which shows you how long it would take to walk between stops:
/cdn.vox-cdn.com/uploads/chorus_image/image/61204563/Screen_Shot_2015-11-11_at_3.01.56_PM.0.0.1447254119.0.png)
But even then, this kind of schematic only really help you to plot single paths. And as anyone who’s been involved in technology delivery will know, the running of IT is a parallel activity, with many thorny interdependencies.
Bottom line on all of this:
- is that there are diagrams that enable people to have conversations and make decisions (see also: Wardley Mapping)
- but tools for decision making are rarely the same as tools for providing assurance, particularly about time.
- assurance is almost always what people who ask for technology roadmaps are actually after
- and even those Gantt Charts masquerading as roadmaps rarely provide any assurance, especially further out in time.
